Social Media Statistics for Australia (Updated August 2026)
Most published social media statistics are US or global-centric, which is unhelpful when you're trying to decide which two or three platforms an Australian B2B business should invest in. This regularly updated post collects Australian social media statistics from a wide range of sources, with the analysis and platform-by-platform recommendations to translate the data into a decision.

On this page
No business can afford to ignore social media as part of its marketing mix. But, unless you are a global multinational, it is also impossible to effectively manage all of the social media networks that are on offer.
To be most effective, companies and their marketing agencies, and customer experience consultants should be active in two or, at most, three networks and communicate with customers in a focused way. This allows you to become proficient in the nuances of the those platforms and maximise results.
And reach percentage alone doesn’t tell you which two: a platform with lower total reach but longer dwell time and a commercial-intent audience can out-perform a bigger, shallower one, which is why the platform-by-platform detail below matters more than the top-line ranking.
The difficulty for Australian organisations is understanding the nuances of which social media channels are most effective and active locally. Typically the published social media statistics focus on a United States or global centric view of the data.
This post compiles Australian social media statistics from across a wide variety of sources, refreshed against DataReportal’s Digital 2026: Australia report (data to October 2025). We have then analysed those statistics to provide recommendations for businesses on which platform are most effective in different use cases.
Australia’s Under-16 Social Media Ban and What It Means for These Statistics
From 10 December 2025, age-restricted social media platforms have been legally required to take reasonable steps to stop Australians under 16 from creating or keeping an account. It is often called a ban, but the eSafety Commissioner is careful to call it a delay: there is no penalty for an under-16 who uses a platform, or for their parents. The obligation sits with the platforms, and so do the fines, up to $54.6 million. (Source)
Crucially, the restrictions do not apply to every platform. eSafety publishes the list, and the split runs straight through the middle of this post:
| Age-restricted (under-16s cannot hold an account) | Not age-restricted |
|---|---|
| Facebook, Instagram, Snapchat, Threads, TikTok, X, YouTube, Reddit, Twitch, Kick | Pinterest, Messenger, WhatsApp, Roblox, Discord, Steam, YouTube Kids |
(Source)
This has three implications for the data in this post:
- 99% of the figures in this post predate the restrictions. The most recent major sources report data to October 2025, about six weeks before the law commenced. This post is a clean pre-restriction baseline, not a description of the market today.
- Any figure quoted on a “13 and over” base is now measuring a population that partly cannot legally hold an account. That covers most of the advertising reach figures below, because the platforms’ own ad tools report against a 13+ audience. It does not cover Pinterest or Messenger, which are outside the restrictions and whose bases are unaffected.
- The age breakdowns for under-16s are now historical by definition. They describe behaviour that was legal when it was measured and largely is not now. Note that Roblox, which dominates the youngest age group further down this page, is one of the services eSafety decided was not an age-restricted social media platform, so it is unaffected.
Overall Australian Social Media Statistics
Australians are reasonably avid consumers of social media. At least as avid as the US market, but not as active as some Asian countries.
High Level Australian Social Media Statistics
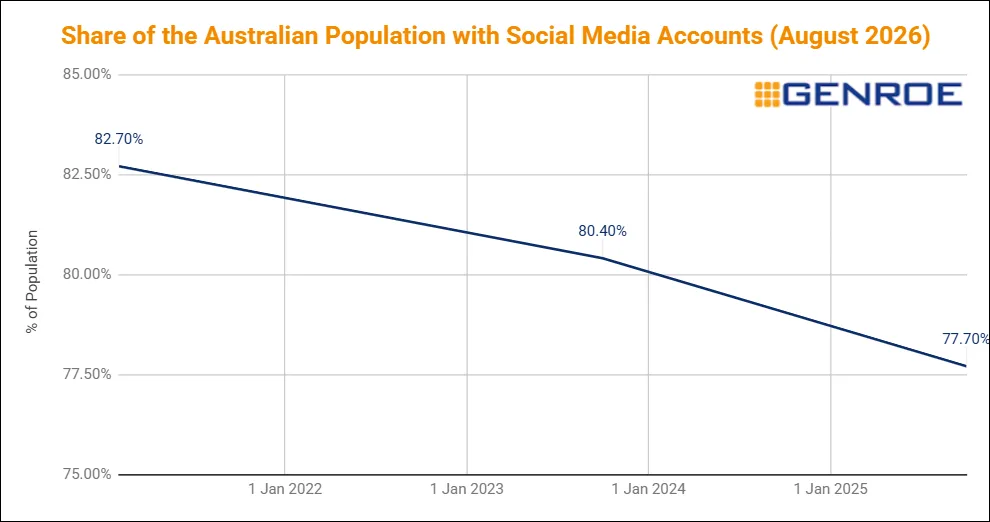
Share of the Australian Population with Social Media Accounts (as at August 2026) (Analysis by Genroe)
- Australians are slowly turning away from social media. In October 2025, 77.7% of the Australian population (21.0 million people) had active social media accounts. This is down from 78.5% in October 2023, 80.4% in February 2023 and 82.7% in February 2021, a slow but consistent decline. (Source, Source, Source, Source, Analysis: Genroe)
- 50.8% of Australian Social Media Users are Women and 49.2% are Male. (Source)
- LinkedIn is the standout mover. Australian LinkedIn membership grew 12.5% in the year to October 2025, to 18.0 million, while X (Twitter) shrank 5.4% over the same period. For B2B advertisers specifically, LinkedIn’s Australian ad reach among adults 18+ has climbed from 67.2% in 2023 to 84.7% in late 2025. (Source, Analysis: Genroe)
- YouTube is Australia’s most popular social media platform. It reached 21.0 million Australians in October 2025, 77.7% of the total population, ahead of Facebook on 17.7 million, or 65.3%. (Source, Analysis: Genroe)
- 98% of Australian users access social media via a mobile device. (Source)
- In October 2023 Australians ( between 16 and 64) spent an average of 1 hour 53 minutes per day on social media. This is down from 2 hours 0 minutes in Q1 2023, which was flat over the prior 36 months of Q1 2020->Q1 2023. (Source, Source, Analysis Genroe)
- Australia is the world’s heaviest user of Snapchat, spending 16 hours 26 minutes per user per month on the app against a worldwide average of 3 hours 20 minutes. (Source, data.ai app data for October 2024, Analysis: Genroe)
- Australians have about the global average (6.7) number of social media accounts per person with an average of 6.3 per person. This should be compared to Japan (lowest – 3.5) and India (highest – 8.1) (Source)
How Australians Use Social Media
- Australians increasingly use social media to follow influencers or other experts on-line. In October 2023, 24.6% said it is a main reason for using social media, up from 19.1% just 12 months earlier (Source, Source)
- Work related use of social media has more than doubled in the 12 months to October 2023 with 30.7% of Australian internet users (16-64) say a main reason for using social media is for work related activities, up from 13.0% in October 2022. (Source, Source)
- 52% of Australian’s use Social Media as a source of news. This is just below the worldwide average of 55% (Source, Analysis: Genroe)
- While 25.1% of Australian’s say a main reason for using Social Media is as a source of news, up from 13% in October 2022, this is far below worldwide average of 34.6% (Source, Source, Analysis: Genroe)
- Australians increasingly turn to social media to learn about brands. In October 2023, 43.6% Australians state they used Social Media when looking for information about a brand. This is up from 38.3% in February 2023 and 30.3% in February 2022 . (Source, Source, Source, Source Analysis: Genroe)
- About a third (36.1%) of Australians use their social networks to find information about brands and products. (Source)
- Social Media News
- 30% more Australians trust their social media news sources than those in the USA but only 73% as many Australians trust their social media news sources than those in The Netherlands. (Source, Analysis: Genroe)
- Australians are concerned about real or fake online news at about the same rate as those in the United States. (Source, Analysis: Genroe)
Australian Social Media Average Time on Site and Traffic Ranks
It’s not surprising that social media sites are some of the most commonly accessed in Australia. Below is an analysis of traffic rank Vs the average daily site visit time.
The Top Australian Social Media Sites By Web Traffic:
| Social Media Rank | All Sites Rank | Social Media Network |
|---|---|---|
| 1 | 2 | Youtube |
| 2 | 3 | |
| 3 (+) | 4 (+) | |
| 4 (+) | 6 (+) | X (Twitter) |
| 5 (-) | 7 | |
| 7 (+) | 9 | TikTok |
| 7 (+) | 17 (+) |
As at August 2026 (Source, Analysis by Genroe)
Trend markers: + rising, - falling.
Australians’ Favourite Social Media Platforms In Rank Order
| Rank | Network | % Saying it’s their “Favourite” and Change |
|---|---|---|
| 1 | YouTube | Excluded |
| 2 | 25.6% - | |
| 3 | 14.3% - | |
| 4 | TikTok | 12.5% ++ |
| 5 | Messenger | 8.9% + |
| 6 | 5.3% — | |
| 7 | Snapchat | 4.2% = |
| 8 | X (Twitter) | 3.3% + |
As at January 2023 (Source, Analysis by Genroe, Proportion of Population 13+)
Trend markers: + rising, ++ rising strongly, +++ rising very strongly, - falling, -- falling strongly, = steady.
How Much Time Australians Spend on Social Media
In Australia in January 2023 the monthly average time using the Android App for the top 4 social media networks was:
| Social Media Network | Monthly Time On Site |
|---|---|
| TikTok | 29 hours 48 minutes +++ |
| 17 hours 48 minutes = | |
| YouTube | 17 hours 6 minutes = |
| 9 hours 36 minutes - | |
| 5 hours 36 minutes - |
(Source. Analysis by Genroe)
Trend markers: + rising, ++ rising strongly, +++ rising very strongly, - falling, -- falling strongly, = steady.
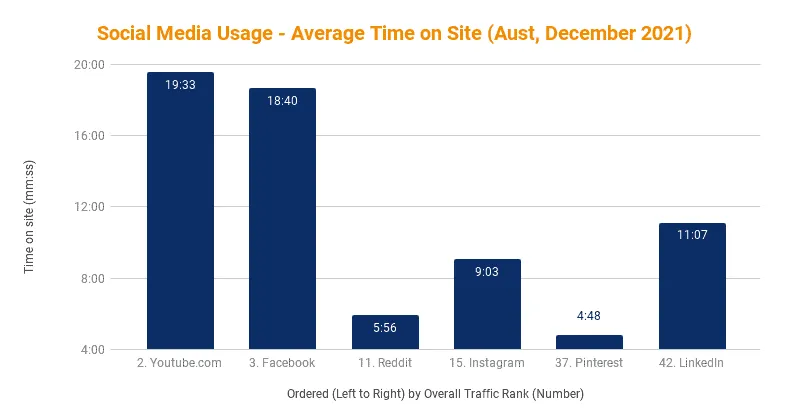
Australia Social Media Usage – Average Daily Time on Site (Source. Analysis by Genroe)
There are several items of particular note in this analysis:
- YouTube has a long dwell time (19:33mins) and offers good opportunities for B2B marketers (Source).
- In January 2023, Reddit, had risen from 12th most trafficked site in Australia to 4th most trafficked site. Dwell time had also fallen to just 5:46 minutes. If may no longer present good opportunities for marketers.(Source, Source)
- LinkedIn, while not being the highest traffic site, has a respectable dwell time of high value B2B users.
Australian Social Media Usage by Age
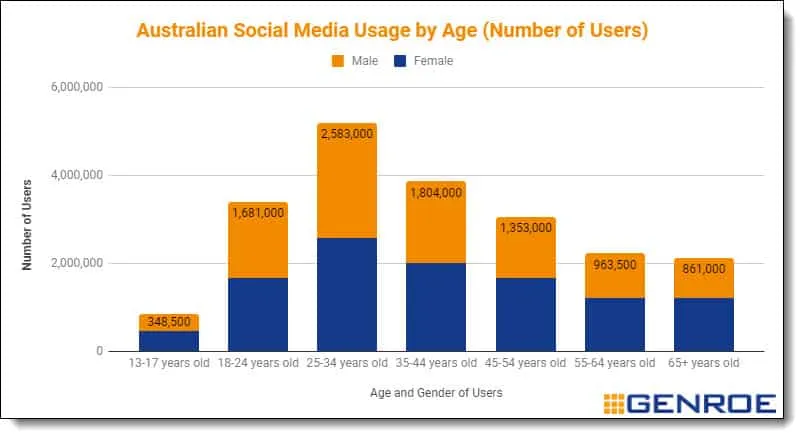
Australian Social Media Usage by Age and Gender (Number of Users) (Source, Analysis by Genroe)
However, when overall population dynamics are included, the over-representation of younger users in social media usage becomes much more muted. It’s really only at age 65+ that usage drops off dramatically as a proportion of overall population.
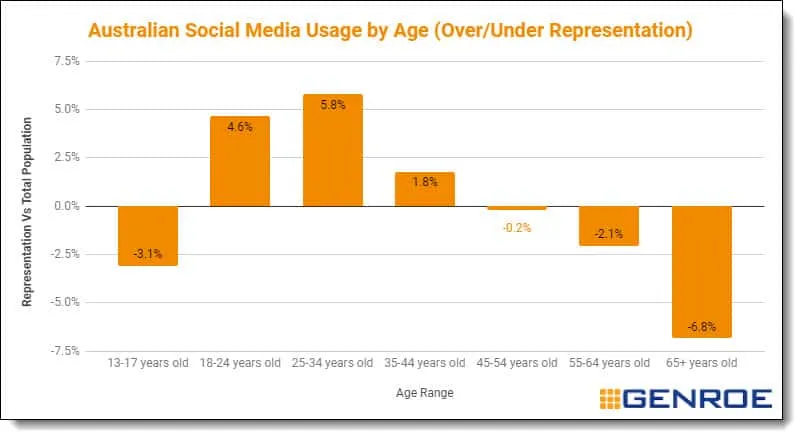
Australian Social Media Use By Age – Over/Under Representation Versus the General Population (Source, Source, Analysis by Genroe)
Australian Social Media Preferences by Age: 18 years and under
Social Media Use – Proportion By Platform, Age 18 and under
| Social Media Network | 7-9 Years Old | 10-12 Years Old | 13-15 Years Old | 16-18 Years Old |
|---|---|---|---|---|
| Roblox | 80% | 49% | 36% | 0% |
| TikTok | 0% | 44% | 33% | 37% |
| 11% | 4% | 4% | 6% | |
| X | 9% | 3% | 2% | 4% |
| Snapchat | 0% | 0% | 25% | 30% |
| 0% | 0% | 0% | 22% |
Social Media Use – Proportion By Platform, Age 18 and under(Source. Analysis by Genroe)
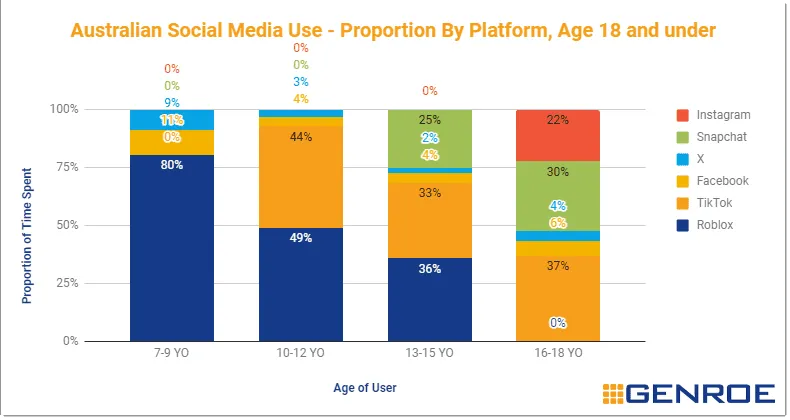
Social Media Use – Proportion By Platform, Age 18 and under(Source. Analysis by Genroe)
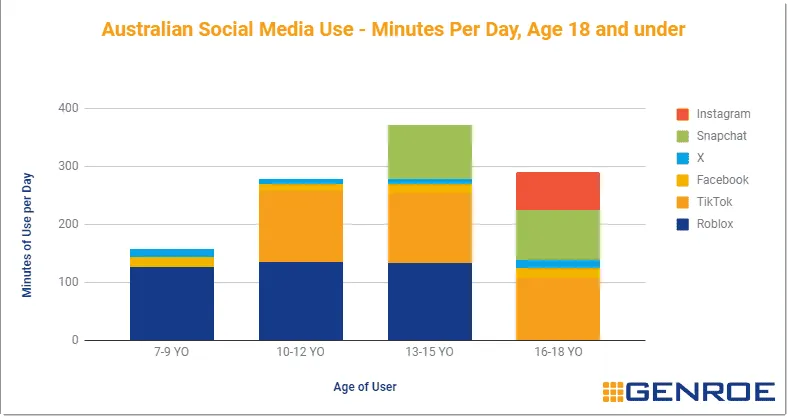
Social Media Use – Minutes of Use Per Day, Age 18 and under
| Social Media Network | 7-9 Years Old | 10-12 Years Old | 13-15 Years Old | 16-18 Years Old |
|---|---|---|---|---|
| Roblox | 127 | 136 | 133 | 0 |
| TikTok | 0 | 122 | 121 | 107 |
| 17 | 11 | 15 | 18 | |
| X | 14 | 9 | 9 | 13 |
| Snapchat | 0 | 0 | 93 | 87 |
| 0 | 0 | 0 | 65 | |
| Total | 158 | 278 | 371 | 290 |
Social Media Use – Minutes of Use Per Day By Platform, Age 18 and under(Source. Analysis by Genroe)
Social Media Use – Active Users by Platform, Age 18 and Under
| Social Media Network | 7-9 Years Old | 10-12 Years Old | 13-15 Years Old | 16-18 Years Old |
|---|---|---|---|---|
| Roblox | 60% | 62% | 47% | 0 |
| TikTok | 0 | 39% | 48% | 44% |
| 33% | 38% | 42% | 46% | |
| X | 36% | 42% | 45% | 42% |
| Snapchat | 0 | 0 | 47% | 46% |
| 0 | 0 | 0 | 50% |
Social Media Use – Active Users by Platform , Age 18 and under(Source. Analysis by Genroe)
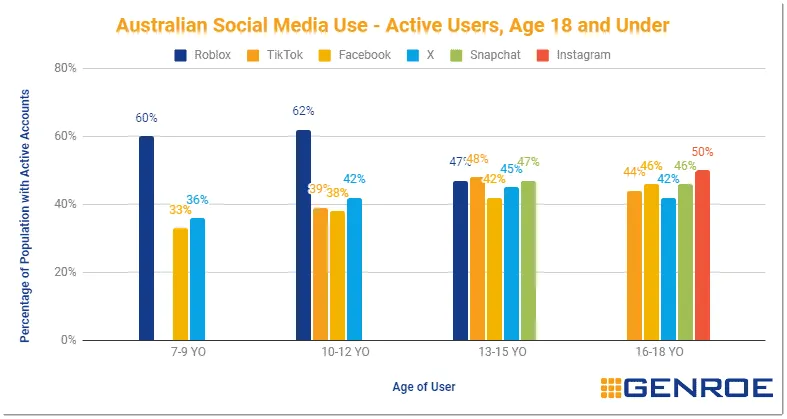
Social Media Use – Active Users by Platform , Age 18 and under(Source. Analysis by Genroe)
Australian Social Media Usage by Gender
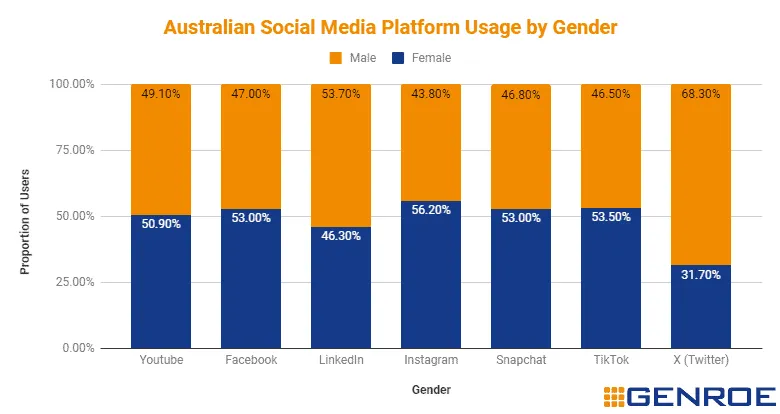
As at January 2023 (Source, Analysis by Genroe)
Australian Social Media Advertising Statistics
- Australian digital advertising grew by 11.6% in the year to January 2023 to be USD 3.71B. (Source,).
- Australia is estimated to be the 5th largest Social Media Advertising market in the world. (Source)
Investing in a platform it is important to identify which platforms your potential customers use, which are growing and which shrinking. This allows you to invest your time wisely for the longer term.
Below are the eligible audience reaches as a percentage of the total Australian population, (13+) for each of the major networks
The Top Australian Social Media Sites By Advertising Reach
| Rank (By Reach) | Network | YoY Growth (Oct 2024–Oct 2025) | Population Reach | Absolute Reach | Female/Male Split (Adults) |
|---|---|---|---|---|---|
| 1 | +4.4% | 77.0% (13+) | 17,700,000 | 50.9% / 46.6% | |
| 2 | +12.5% | 66.6% | 18,000,000 | 47.2% / 52.8% | |
| 3 | +8.6% | 66.1% (13+) | 15,200,000 | 54.8% / 44.6% | |
| 4 | TikTok | +13.9% | 51.2% (18+) | 10,900,000 | 46.4% / 53.6% |
| 5 | Snapchat | +2.4% | 35.6% (13+) | 8,170,000 | 51.4% / 48.2% |
| 6 | +7.5% | 24.8% (13+) | 5,680,000 | 72.3% / 20.4% | |
| 7 | X (Twitter) | -5.4% | 20.7% (13+) | 4,740,000 | 29.2% / 70.7% |
| 8 | Threads (new) | n/a | 5.9% (13+) | 1,350,000 | 44.8% / 54.3% |
| 9 | Messenger | +32.6% | 2.6% (13+) | 594,000* | 51.8% / 46.8% |
As at October 2025 (Source: DataReportal Digital 2026: Australia, Analysis by Genroe). YouTube is omitted as Google no longer publishes a country-level YouTube ad-audience figure. The October 2023 YouTube figure (86.8% of the 18+ population) previously topped this table. LinkedIn’s Population Reach is measured against total population rather than 13+, since LinkedIn’s own eligible-audience base is registered members of any age; see the note below for LinkedIn’s adult ad-reach figure, which is directly comparable to 2023.
* Messenger’s figure looks implausibly small next to Facebook’s because Meta reports a separate, much narrower advertising audience for Messenger rather than counting everyone who uses the app. Read it as the size of the Messenger ad product in Australia, not as the number of Australians who message.
Reach Is Not Attention: Australia Social Media Platforms Ranked by Engagement
The table above ranks platforms by how many Australians they can reach. It says nothing about whether Australians then use them. Rank the same country by engagement instead and the order changes almost completely.
Every number below is Australia’s world ranking, so 1st is best. The platforms are ordered by how far their engagement ranking sits from their reach ranking, which puts the biggest surprises at the top.
| Platform | Can reach Australians | Time Australians spend | Times Australians open it | The pattern |
|---|---|---|---|---|
| TikTok | 41st | 17th | 34th | Engagement well ahead of reach |
| Snapchat | 14th | 1st | 2nd | Narrow reach, the world’s most engaged users |
| 8th | 5th | 7th | Strong on all three | |
| 12th | 11th | 34th | Long visits, but infrequent ones | |
| 9th | 16th | 37th | Highly reachable, rarely opened | |
| X (Twitter) | 20th | 38th | 38th | Reach without attention |
| YouTube | 9th | 30th | 26th | Highly reachable, little time spent |
Rankings are Australia’s position among ~ 58 countries; the exact number varies because sources measure different country sets. Read these as a pattern rather than a like-for-like ratio. (Source, Analysis by Genroe)
Three implications:.
- On Meta’s platforms (Facebook, Instagram) Australians are reachable but infrequent. Instagram reaches the 9th highest share of adults of any country measured, yet Australians rank 37th of 52 for how often they open it: 203.5 sessions a month against a world average of 331.8. Facebook splits the same way, 12th for reach and 34th for frequency. Being able to reach an audience is not the same as that audience turning up.
- Snapchat and TikTok invert it. Snapchat reaches a smaller share of Australian adults than Facebook, Instagram or YouTube do, yet Australians spend more time on it than any other nation on earth. TikTok reaches only the 41st highest share of adults but ranks 17th for time spent. Both are narrow and deep. X manages the opposite of both, 20th for reach and 38th for engagement on either measure.
- LinkedIn is the only network where Australia ranks near the top on all three. 8th for reach, 5th for time spent, 7th for how often it is opened. On no other platform are Australians both broadly present and comparatively engaged.
Unfortunately there are no locally available data on social media advertising fees for Australia but the following global statistics provide an effective ready reckoner on what to expect on a relative basis.
What is clear here is the predominately B2B network (LinkedIn) has much higher cost per click rates AND much lower click through rates. This generally equates with the value per sale being higher in B2B marketing and the cost per lead being acceptably higher.
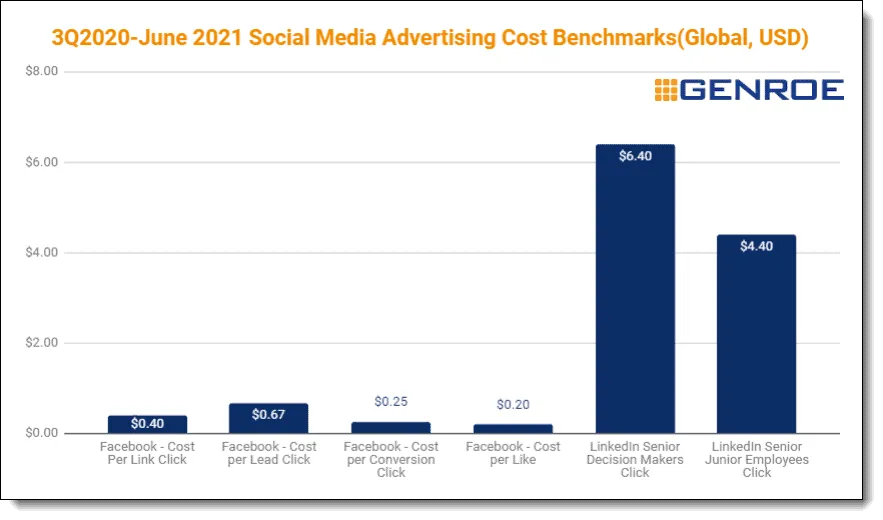
Source, Source, Analysis by Genroe
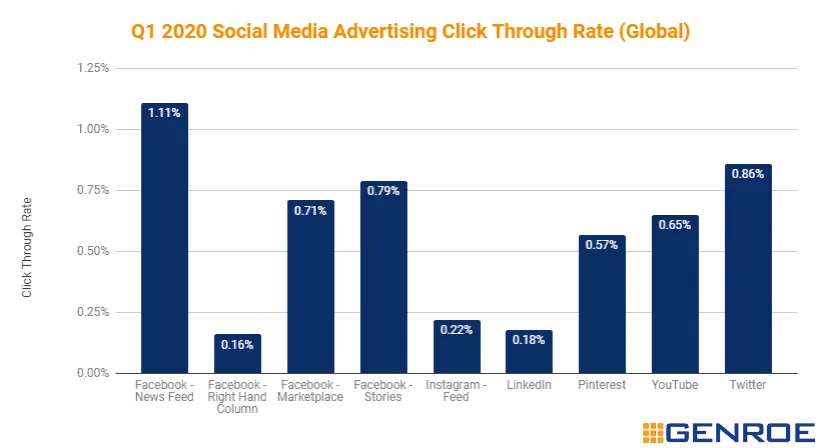
Source. Analysis by Genroe
Australian Internet access
- There are approximately 1.26 mobile connections for every man, woman, and child in Australia (34.1 million cellular connections against a 27.0 million population) – essentially unchanged since 2020, despite the population growing. (Source: Digital 2020: Global Digital Overview, DataReportal Digital 2026: Australia, Analysis by Genroe)
- 97.1% of Australians have access to the internet as at October 2025, up from 96.2% two years earlier. (Source, Source, Analysis by Genroe)
- Australians spend an average of 6 hours and 24 minutes accessing the internet everyday – in the bottom 40% of all countries. This is up from 5 hours and 50 minutes 12 months prior. (Source, Analysis by Genroe)
- 95.3% of Australians use Mobile Phones to access the internet and 79.9% use computers. In terms of time for each device it is split 47% Mobile / 53% computer, one of the lowest mobile phone proportions in the world. (Source, Analysis by Genroe)
- 86.1% of Australians aged 16-64 use their mobile phone to access the internet while only 77.1% use a computer to access the internet. (Source)
- Australia’s median fixed-line download speed is 162.34 Mbps, the world’s 50th fastest, and comfortably above the global median of 125.59 Mbps. It is still around a third the speed of top-ranked Singapore (447.75 Mbps). (Source, June 2026 index, Analysis by Genroe)
- Australia’s median mobile download speed is 116.26 Mbps, the world’s 41st fastest, and only marginally above the global median of 112.07 Mbps. It remains well behind the United States (197.34 Mbps). Australia’s mobile ranking has slipped over recent years even as absolute speeds rose, because other markets improved faster. (Source, June 2026 index, Analysis by Genroe)
- 31.1% of of Australian internet users (16-64) use tools to block ads online in October 2023 this is about stable from 33.7% in October 2021 and 32.5% in October 2021 (Source, Source)
- 44.3% of Australian internet users (16-64) are concerned about mis-use of their personal data. This is the 7th highest rate in the world and up from 37.0% on October 2022 (Source, Source)
- In October 2023, 31.3% of Australian internet users (16-64) decline cookies at least some of the time. That is down from 40.5% in October 2022. (Source, Source)
- 25.1% of of Australian internet users (16-64) use a VPN service for at least some of their on-line activities. This is 13th highest rate in the world but has decreased from 27.4% in October 2022. (Source, Source, Analysis by Genroe)
Australian Internet Media Consumption
Australians internet media consumption is substantial. In October 2023 (Source ) it looked like this:
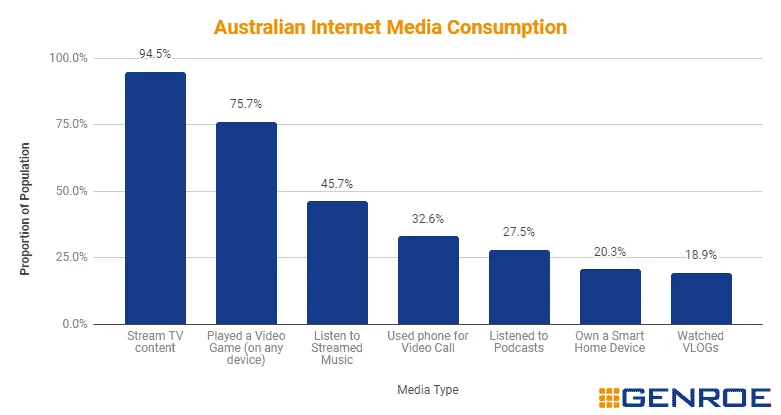
Australian Internet Media Consumption by Type
Here are the numbers:
| Internet Media Type | Change in Australians Using |
|---|---|
| 27.5% (Oct 2023) of Australian internet users (16-54) listen to podcasts | Up from 23.3 % (Jan 2023) and 19.5% (Oct 2021) |
| 18.9% (Oct 2023) of Australian internet users (16-54) watch VLOGs | Up from 16.1% Oct 2021 |
| 45.7% (Oct 2023) of Australian internet users (16-54) listen to Streamed Music | |
| 32.6% (Jan 2023) of Australian internet users (16-54) use their phone for video calls | Up from 29.3% Oct 2021 |
| 94.5% (Oct 2023) of Australians (16-64) stream TV content via the internet | Up from 92.4% Jan 2023 |
| 75.7% (Oct 2023) of Australians (16-64) play video games (on any device) | Up from 74.5% (Jan 2023) and 75% Oct 2021 |
| 20.3% (Oct 2023) of Australians (16-64) own a smart home device. The 10th highest rate in the world. | Up from 16.9% (Jan 2023) and 14.4% Oct 2021 |
| 36.7% (Oct 2023) of Australian use QR codes on their mobile each month. In the bottom third of global usage rates. | |
| 45.9% (Oct 2023) of Australian use online Financial Services each month. The 7th highest rate in the world and almost double the global average of 26.8%. | |
| 20.5% (Oct 2023) of Australians check health symptoms on-line at least weekly. In the bottom half of usage globally. |
Source, Source, Analysis by Genroe
Key Australian Facebook Facts
- Facebook is Australia’s second most popular social media platform, behind YouTube. Its advertising reach was 17.7 million people in October 2025: 65.3% of the total population, 77.0% of the eligible 13+ audience, and 82.8% of adults aged 18 and over. (Source, Analysis by Genroe)
- Facebook is Australia’s 3rd highest trafficked site after Google and YouTube. (Source)
- Australia Facebook users are the fourth most active “Likers” in the world an average of 15 likes per month vs the global average of 12. (Source, Analysis: Genroe)
- Australia Facebook users are equal 6th most active “commenters” in the world an average of 8 comments per month vs the global average of just 5. This has declined in the last 12 months by 1 comment per month (Source, Analysis: Genroe)
- Visitors spend an average of 18 min 49 secs and view 8.29 pages per day on Facebook (Apr-Jun 2020, (Source)
Australian Share of Facebook page posts by Post type
| Post Type | Share of Total Page Posts |
|---|---|
| Photo posts | 49.15% |
| Video posts | 12.89% |
| Link posts | 37.41% |
| Status posts | 0.55% |
Australian Facebook Post Engagement Benchmarks
| Post Type | Average Engagement as Percent of Fans |
|---|---|
| All Posts | 0.06% |
| Photo posts | 0.09% |
| Video posts | 0.05% |
| Link posts | 0.02% |
| Status posts | 0.16% |
Australian Facebook Demographics
While users skew to the 25-34 age group, there are about 1.9 million Facebook users over 65 in Australia (Facebook data analysis by Genroe)
| Age | Number of Users |
|---|---|
| 13-17 years old | 820,000 |
| 18-24 years old | 4,000,000 |
| 25-34 years old | 5,100,000 |
| 35-44 years old | 3,900,000 |
| 45-54 years old | 2,900,000 |
| 55-64 years old | 2,100,000 |
| 65+ years old | 1,900,000 |
Australian Facebooks Demographics (Age) (Facebook data analysis by Genroe)
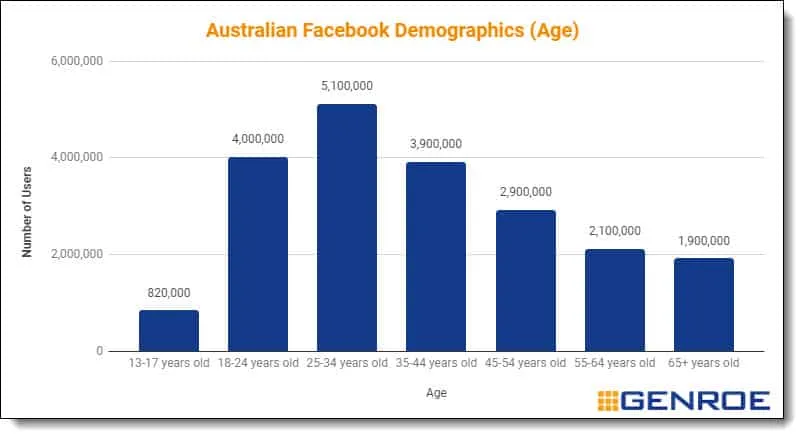
Australian Facebooks Demographics (Age) (Facebook data analysis by Genroe)
Australian Facebook Advertising Statistics
- Total advertising audience: 17.7 million people, 77.0% of the Australian population aged 13 and over, as at October 2025. (Source)
- Australia Facebook users are some of the most active advert clickers in the world an average of 22 adverts clicked per month vs the global average of 12. This is in the top 8% of countries globally. (Source, Source Analysis: Genroe)
- Facebook has an estimated 80% market share of the Australian Social Media Advertising market. (Source)
Facebook Australian Advertising Audience By Education
- University Graduate: 5.1 million (Source)
Meta’s Australian Ad Audience Demographic Profile (Facebook, Instagram, Messenger):
| Age | Female | Male |
|---|---|---|
| 13-17 | 2.8% | 2.0% |
| 18-24 | 9.6% | 8.8% |
| 25-34 | 11.9% | 11.9% |
| 35-44 | 9.8% | 8.5% |
| 45-54 | 7.8% | 6.7% |
| 55-64 | 5.9% | 4.5% |
| 65+ | 5.7% | 4.1% |
As at January 2023 (Source, Analysis by Genroe, Proportion of Population 13+)
Meta’s Australian Ad Audience Gender and Age Profile (Facebook, Instagram, Messenger):
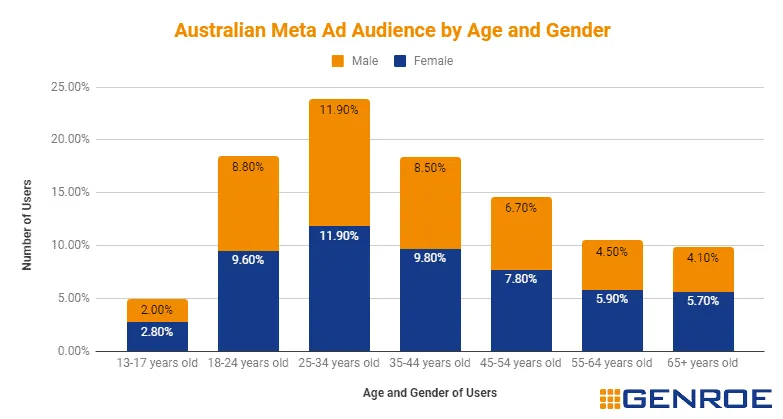
As at January 2023 (Source, Analysis by Genroe, Proportion of Population 13+)
Facebook Advertising Costs and Conversion Rates Q3 2020 (Global)
Key Australian LinkedIn Facts
- LinkedIn is Australia’s premier B2B Social Media platform.
- Visitors spend an average of 10 min 42 secs and view 8.52 pages per day on LinkedIn (December 2020, Source)
- 59% of LinkedIn Users return fewer than 3 times a week. (Source)
- LinkedIn has an estimated 5% market share of the Australian Social Media Advertising market. (Source)
- 66.6% of Australians have a LinkedIn account (18.0 million registered members), up 12.5% in the year to October 2025 – the fastest growth of any established platform in this list bar TikTok. (Source Analysis by Genroe)
- LinkedIn’s Australian ad reach among adults 18+ has jumped from 67.2% in 2023 to 84.7% in late 2025. (Source)
- Australia ranks 8th out of 57 countries for LinkedIn advertising reach as a share of adults. On the January 2025 snapshot used for that international comparison, Australian reach was 80.5% against a worldwide average of 20.7%, nearly four times the global rate. It has since risen to the 84.7% quoted above. Note that LinkedIn counts registered members rather than active users, so this measures how many Australians have an account, not how many use it. (Source, Kepios data for January 2025, Analysis: Genroe)
- Australians also rank 5th out of 52 countries for time spent on the LinkedIn app, at 1 hour 6 minutes per user per month against a worldwide average of 48 minutes, and 7th for how often they open it. (Source, data.ai app data for October 2024, Analysis: Genroe)
The implication for B2B business using LinkedIn is that they need to post new content several times a week to ensure that it gets in front of the majority of uses in the infrequent number of times they visit the site.
That 84.7% adult ad-reach figure is important. In 2023 LinkedIn’s reach in Australia was roughly on par with a mid-tier platform; it’s now close to universal among working-age adults, while X’s reach has kept shrinking (see the X section below).
What makes LinkedIn unusual in Australia is not just that it is growing. It is that Australians turn up. Of the seven platforms we can rank both ways, LinkedIn is the only one where Australia sits near the top of the world on reach, on time spent and on how often the app is opened, all at once. On Facebook and Instagram, Australians are highly reachable and comparatively disengaged. On LinkedIn they are both.
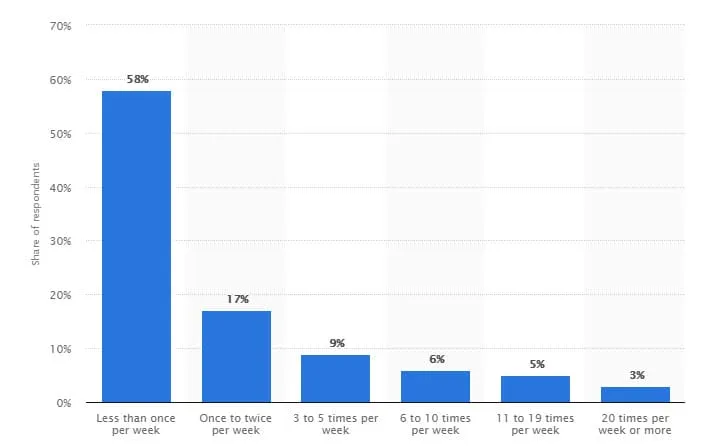
Share of LinkedIn Users In Australia by Frequency of Use, April 2018 (Source)
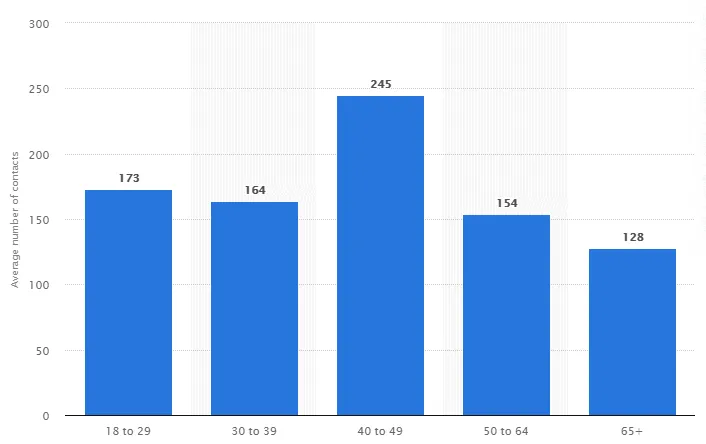
Average number of LinkedIn contacts in Australia as of April 2018, by age group (Source: Statista)
Australian LinkedIn Advertising Statistics
- LinkedIn is one of only three only global social networks (Tiktok, Twitter, Facebook, Instagram, Youtube, Snapchat, LinkedIn, Pinterest) where Australia ranks in the top 20 countries for advertising reach.(Source, Analysis: Genroe)
- Australia is the 16 highest percentage of population LinkedIn advertising reach market in the world and the equal 13th largest total market. (Source, Analysis: Genroe)
LinkedIn Australian Advertising Audience By Seniority
| Seniority | Audience |
|---|---|
| High level individuals (Partner, Owner, Director, CXO, VP) | 2.0 million |
| Middle Management (Managers, Senior staff) | 4.3 million |
| Junior (Unpaid, training, entry level) | 4.8 million |
| All “Permanent Location” Australia | 19 million |
LinkedIn Advertising Audience By Position Seniority (Source: LinkedIn 2026, Data Analysis by Genroe)
Note that the seniority bands do not add to the total, because LinkedIn does not hold seniority data for every member. The 19 million figure is LinkedIn Campaign Manager’s own 2026 “Permanent Location: Australia” audience size, measured with a different tool and at a later date than the 18.0 million members reported for October 2025 elsewhere in this post. Use 18.0 million when comparing LinkedIn against the other platforms here, and treat the larger number as what an advertiser actually sees when building an audience today.
LinkedIn Australian Advertising Audience By Company Size
| Company size | Audience |
|---|---|
| Micro-Companies (up to 10 employees) | 600,000 individuals |
| SMEs (11 to 200 employees) | 1,300,000 individuals |
| Corporate (201-1000 employees) | 770,000 individuals |
| Enterprise (1001+ employees) | 2,300,000 individuals |
LinkedIn Advertising Audience By Company Size (Source: LinkedIn 2024, Data Analysis by Genroe)
Note that these company-size bands were collected earlier than the seniority table above, when LinkedIn reported around 11 million Australian members, and they do not add to that total because LinkedIn does not hold company-size data for every member. For scale, LinkedIn reported 18.0 million Australian members by October 2025.
LinkedIn Advertising Costs and Conversion Rates Q2 2021 (Global)
- Average Cost per Click: USD5.58
- Senior decision-makers: $6.40
- Junior employees: $4.40
- Average Cost per Thousand impressions (CPM): USD33.80
- Global Cost per Lead ranges from $15 to $350
- Linkedin Lead gen form completion rate benchmark: 10%
- Average Click Through Rate for APAC: 0.8%
(Source)
Key Australian Instagram Advertising Statistics
- Instagram reaches 66.1% of the Australian population aged 13+ (15.2 million people), up from 52.5% four years ago and growing 8.6% in the year to October 2025.(Source, Source, Source, Source, Analysis: Genroe)
- 54.8% of Instagram’s adult users are Female and 44.6% are male. (Source)
Key Australian Snapchat Advertising Statistics
While Snapchat reaches only about a third of Australian adults, far behind Facebook, Instagram and YouTube, the third it does reach are the most engaged Snapchat users in the world.
Australians spend more time on Snapchat than any other nation on earth.
For a business choosing two or three networks, that combination of narrow reach and extreme engagement makes Snapchat a poor choice for broad awareness and a strong one for a young, tightly defined audience.
How Much Time Do Australians Spend on Snapchat?
- Australia ranks 1st in the world for time spent on Snapchat, at 16 hours 26 minutes per user per month against a worldwide average of 3 hours 20 minutes. That is 4.9 times the global average, and ahead of second-placed Ireland on 14 hours 1 minute. (Source, data.ai app data for October 2024, Analysis: Genroe)
- Australia ranks 2nd of 52 countries for how often people open the app, at 490.2 sessions per user per month against a worldwide average of 136.0. Only Canada opens Snapchat more often, on 550.7. (Source, data.ai app data for October 2024, Analysis: Genroe)
- Australians spend roughly two and a half times as long on Snapchat as Americans do: 16 hours 26 minutes a month against 6 hours 25 minutes. (Source, data.ai app data for October 2024, Analysis: Genroe)
Snapchat Advertising Reach in Australia
- Total Australian Snapchat advertising audience reach is 35.6% of the Australian population aged 13+ or 8.17m people, up from 33.7% in 2021. Growth in the most recent year was a modest 2.4%.(Source, Source)
- Australia has the 15th largest Snapchat advertising audience reach market in the world. Up two spots since 2020. (Source, Source, Analysis: Genroe)
- Snapchat is one of only three only global social networks (Tiktok, Facebook, Instagram, Youtube, Snapchat, LinkedIn, Twitter) where Australia ranks in the top 20 countries for advertising reach.(Source, Analysis: Genroe)
- Snapchat has an estimated 5% market share of the Australian Social Media Advertising market. (Source)
Key Australian X (Twitter) Advertising Statistics
Australians are unusually likely to be reachable on X and also unusually unlikely to actually use it!
X reaches 24.6% of Australian adults against a worldwide average of 9.9%, roughly two and a half times the global rate.
Yet Australians rank 38th of 52 countries for time spent on the app, at about half the world average.
Is X Losing Its Australian Audience?
- Australians spend 2 hours 44 minutes a month on the X app against a worldwide average of 4 hours 57 minutes, ranking 38th of 52 countries. They open it 67.8 times a month against a worldwide 120.4, also 38th. That is roughly 55% of the world average on both measures. (Source, data.ai app data for October 2024, Analysis: Genroe)
- X’s Australian advertising reach fell 13.9% in the year to February 2025, a loss of 848,000 people, and 5.4% in the year to October 2025. The decline is sustained across both readings, though it is slowing. (Source, Source, Analysis: Genroe)
- X is the only major platform whose Australian audience shrank over the period. Every other established network grew.
The practical read: an audience you can reach but who are not paying attention is worth less than the reach figure suggests. On the engagement comparison above, X is the clearest example on this page of reach and attention pointing in opposite directions.
X Advertising Reach in Australia
- Australia is not in the top 20 Twitter (X) advertising audience reach markets in the world for either percentage of population or total population. (Source, Analysis: Genroe)
- Total Australian X (Twitter) advertising audience reach has fallen to 20.7% of Australians aged 13+ (4.74 million people), down 5.4% in the year to October 2025 – the only major platform in this post that shrank over the period. (Source, Source, Source, Source)
- From January 2020 to July 2020 Twitter fell out of the top 50 most trafficked sites in Australia. Twitter does not have the same influence in Australia as it does in other geographies, and its Australian reach has continued falling since the platform became X.
- Twitter has an estimated 5% market share of the Australian Social Media Advertising market. (Source)
Key Australian Pinterest Advertising Statistics
- Total Australian Pinterest advertising audience reach has grown to 5.68m people, up 7.5% in the year to October 2025. This is 24.8% of the Australians aged 13+, up from 21.5% four years earlier. (Source, Source, Source, Source, Source Analysis: Genroe)
- Australia has the 13th largest Pinterest advertising audience reach market in the world. This has fallen four places place in the last 24 months. (Source, Source, Source, Analysis: Genroe)
- Pinterest is one of only three only global social networks (Tiktok, Twitter, Facebook, Instagram, Youtube, Snapchat, LinkedIn, Pinterest) where Australia ranks in the top 20 countries for advertising reach.(Source, Analysis: Genroe)
- Pinterest’s Australian audience is heavily skewed female (72.3%) versus male (20.4%), a wider gap than any other platform in this post – worth knowing before assuming a channel’s reach number applies evenly across your customer base. (Source, Analysis: Genroe)
Key Australian TikTok Advertising Statistics
Fewer Australians are on TikTok than in most comparable countries, but the ones who are there spend more time on it than they spend on anything else.
How Much Time Do Australians Spend on TikTok?
- Australians spend 38 hours 51 minutes a month on the TikTok app. That is more than they spend on any other platform on this page, and more than double their time on Snapchat, the platform where Australia leads the world. (Source, data.ai app data for October 2024, Analysis: Genroe)
- Australians have the 4th longest TikTok sessions in the world, averaging 7 minutes 40 seconds per visit against a worldwide average of 5 minutes 50 seconds. Only Japan, the United States and the United Kingdom sit longer. (Source, data.ai app data for October 2024, Analysis: Genroe)
- They open it less often than most, though: 304 times a month against a worldwide average of 359, ranking 34th of 52 countries. Australians visit TikTok less frequently than average and stay much longer when they do. (Source, data.ai app data for October 2024, Analysis: Genroe)
On reach, Australia ranked 41st of the 55 countries measured in January 2025. The pattern is the same one Snapchat shows and the opposite of Facebook and Instagram: a narrower audience that pays much closer attention. If your customers are on TikTok at all, you have more of their time than the reach figure implies.
A caution specific to TikTok. Its reported Australian audience is the most volatile on this page. TikTok’s own ad tools showed the reach falling 16% in the single quarter to February 2025, then growing back over the following three quarters. Kepios advises that platform base revisions can distort change over time, so TikTok’s Australian trend deserves more caution than the others here. (Source, Analysis: Genroe)
TikTok Advertising Reach in Australia
- Total Australian TikTok advertising audience reach among adults 18+ reached 51.2% in October 2025 (10.9 million people), up from 40.3% in January 2023 and growing 13.9% in the year to October 2025, the fastest of any major platform in this post. Messenger grew faster in percentage terms, at 32.6%, but from a base of only 594,000 people. (Source, Source)
- TikTok had 8.26 million users aged 18 and above in Australia in Q2 2023; that adult audience has since grown to 10.9 million. (Source, Source)
- 53.6 percent of TikTok’s ad audience in Australia was male, while 46.4 percent was female in October 2025 – the gender split has reversed slightly since 2023, when the audience skewed female. (Source, Source)
Key Australian Threads Facts
Threads didn’t exist the last time this post’s platform list was drawn up. Meta launched it in mid-2023, and by October 2025 it had reached 5.0% of the Australian population (1.35 million users), or 5.9% of the 13+ eligible advertising audience.
- 1.35 million Australians use Threads, 5.0% of the total population. (Source)
- Threads’ Australian audience skews slightly male (54.3%) versus female (44.8%). (Source)
That’s a smaller reach than every platform above except Messenger, and not yet a case for adding a fourth or fifth network to your mix. We’re tracking it here so the next update has a clean baseline, not because the current numbers justify a change in strategy.
Last Updated 17 August 2026