Customer Effort Score vs NPS: The Research Favours NPS
Customer Effort Score was sold as the metric that would dethrone NPS. But new independent research from Groningen, with no axe to grind, runs the numbers and the result is more interesting than either camp saw coming.

On this page
Is the new iPhone better than the latest Android phone? Ask 10 people and you’ll get 10 different answers, all of them based on opinion.
It’s similar with customer feedback metrics. Should you use Net Promoter® or Customer Effort Score or Customer Satisfaction or some other new fad metric?
Opinions vary widely based on the last blog the person has read.
A lot of what’s written on this question still argues from one of two angles.
Some point back to the original Customer Effort Score paper - the 2010 Harvard Business Review research. That found 96% of customers who had a high-effort experience became disloyal, against 9% of low-effort ones, and concluded Customer Effort Score is the better metric.
Others, more common in 2026, say you should use both: NPS for the relationship, CES for the touchpoint, as if the two were simply measuring different things equally well.
Neither position verifies the claim against what actually happens to customer retention, which is the only test that matters.
The best empirical answer is still a paper from the University of Groningen, because it ran the comparison on actual retention data rather than opinion or a single company’s internal numbers.
What’s nice about this paper is that the researchers don’t seem to have an axe to grind. They don’t work for one of the competing consulting firms that promote this question or that question. Hopefully that makes their research more balanced.
They also look to have done their work very thoroughly, with good sample sizes and methodologies. They controlled for a variety of factors including duration as a customer.
I’m not qualified to assess the statistical approaches they used as they are ahead of my knowledge in this area but I have assumed that they are appropriately used.
What the Groningen Study Actually Tested
The study, published as “The predictive ability of different customer feedback metrics for retention” (de Haan, Verhoef and Wiesel, International Journal of Research in Marketing, 2015), ran on data from 93 firms across 18 industries.
Through a series of surveys and advanced statistics, the authors investigated:
- The predictive power of a range of customer feedback metrics
- Across industry, firms and individual customers
Seven Findings From the Retention Data
Seven findings stand out from the paper, and each one is worth applying directly to how you read your own feedback metrics.
NPS Is an Effective Predictor of Customer Retention
With our findings, we can state that, in contrast with previous research (e.g., Keiningham, et al., 2007b), monitoring NPS does not seem to be wrong in most industries. Our findings indicate that the NPS is an effective predictor of customer retention, though the top-2-box customer satisfaction is slightly better overall.
and:
… changes in top-2-box customer satisfaction, followed by the official NPS, have the highest impact on customer retention.
Much has been made of the work of Keiningham, et al. in “proving” NPS is not predictive. This comprehensive research rejects that conclusion.
Customer Effort Score Is Not Effective
Yet, by quite a large margin, CES is still the worst-performing CFM. Thus, even for the group for which the CES was designed, it is still outperformed by the other CFMs.
Customer Effort Score may be a great idea, but it’s less effective than all of the other metrics analysed.
The authors go on to say:
In terms of the limited overall incremental value of the CES in itself, managers should be reluctant to adopt any metrics that have a past focus and are limited in focus on one specific attribute and/or incident as an overall key performance metric.
Greater Engagement Leads to Greater Retention
… indicating that people who make requests are more likely to remain customers.
Generally, customers that interact with our brands are more likely to remain customers than those that don’t. The practical implications of this finding are difficult to determine but any way that you can continue to engage with your customers would seem to be a good thing.
Linear Scales Don’t Work as Well as Segmented Scales
In general, transforming scales of the CFMs [Customer Feedback Metrics] to capture the proportion of most satisfied customers (as is done with the top-2-box customer satisfaction) or splitting customers up into groups (as is done with the promoters and detractors of the NPS) is preferable to using the full scale of the CFMs.
The link between customer responses and customer retention is not linear and when analysing responses it is necessary to focus on the ends of the scale. The simple customer satisfaction score is not as good an indicator as top-2-box scores. The Net Promoter score is a better indicator than the unscaled response to the “would recommend” question.
Also:
We clearly find that the top-2-box customer satisfaction and the official NPS, which focus on the extremes, outperform the CFMs that use the full scale.
Combining Metrics Can Lift Your Accuracy
In this case they are not suggesting adding top-2-box customer satisfaction to Net Promoter Score but simply tracking and reporting on both indicators.
Combining metrics, especially the CES with the customer satisfaction–related CFMs, results in improved out-of-sample retention predictions. A dashboard of CFMs that measure different dimensions, as indicated in our conceptualization, is preferable to monitoring a single CFM.
Top-2-Box Customer Satisfaction and NPS Tie as the Best Metric to Use
The weights reveal a 49.6% certainty that the top-2-box customer satisfaction is the best CFM and a 49.1% certainty that the official NPS is the best CFM; thus, these two CFMs are almost equally likely to be the best CFM, and it is very unlikely that one of the other CFMs is the best.
NPS Is Best for Identifying Risky Customers
The authors kindly provided a handy dandy lookup table for which metric to use when.
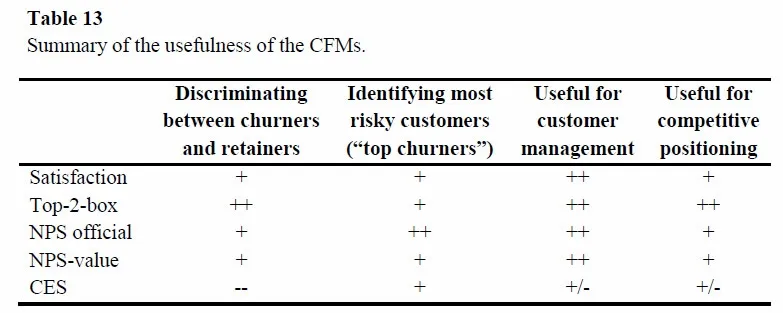
Extract from “The predictive ability of different customer feedback metrics for retention,” de Haan, Verhoef and Wiesel (2015)
In summary, by this evidence, Net Promoter Score is the metric worth focusing on. Customer Effort Score is last on every measure in the table.
A 2025 Study Complicates the Clean Verdict
The Groningen research is strong and the 2025 study doesn’t contradict it so much as explain it.
A 2025 study in Administrative Sciences, “Measuring Customer Experience in E-Retail” by Paulo Botelho Pires, Beatriz Martins Perestrelo and José Duarte Santos, surveyed 359 online shoppers and modelled, statistically, how effort, experience, satisfaction, loyalty and NPS relate to each other.
The finding: effort doesn’t compete with NPS for the same job. It sits upstream of it.
Lower effort improves the customer’s experience, which lifts satisfaction, which then drives both loyalty and NPS. Customer Effort Score isn’t a rival headline metric, it’s one of the mechanisms that moves the metrics that actually predict retention.
That’s a B2C e-retail study, not B2B, so I wouldn’t lift the exact causal chain and apply it unchanged to a relationship with a handful of high-value accounts.
But the shape of the finding matches what the Groningen data already showed: Customer Effort Score alone is weak as a predictor because, on its own, it skips past the thing that actually decides whether a customer stays, which is the overall relationship, not one interaction.
What This Means for a B2B Feedback Programme
The 2025 finding doesn’t mean effort doesn’t matter. It means effort is the wrong number to put at the top of the dashboard.
I recommend tracking Net Promoter Score as the governing relationship metric, i.e. the number the business reports each month.
On the other hand, effort can be measured operationally, at the specific points in the journey where it’s likely to be a problem: onboarding, support tickets, invoicing, order changes. It’s the diagnostic data, feeding root cause work on the account, not a competing scoreboard.
I’ve seen this play out with a technology company whose support team fixed customer-reported issues without telling the customer.
Nothing wrong with the fix itself. But a customer who doesn’t hear back assumes nothing happened, because from where they sit, nothing visibly did. An effort score on that account would have scored the experience as hard work, not because the fix was hard, but because the company never closed the loop. Once the team started telling customers what had changed, the same fixes started reading as good service instead of invisible effort.
The process didn’t change. The communication did.
That’s the real argument against treating Customer Effort Score as a stand-alone metric. It measures perceived friction at one moment.
Perception is manageable independently of whether the underlying process actually got harder or easier. Feed a low score into a structured root-cause process rather than reacting to the number itself, and you often find the fix is communication, not a process redesign.
For an account-based business, the relationship still has to be the number you report on. Net Promoter Score tests ahead of effort for that job. That’s what the research above says, and it’s also why I weight that number by account value rather than treating every response the same.
Need Help Choosing the Right Metric?
If you’re trying to decide which number goes on the board, I’m happy to talk it through. Most B2B feedback programmes I review are tracking three or four metrics with no clear view on which one actually predicts anything in their business.
Frequently Asked Questions
Is Customer Effort Score Better Than NPS?
- No, not as a stand-alone metric. Independent research testing actual retention data (de Haan, Verhoef and Wiesel, 2015) found Customer Effort Score the weakest predictor of the customer feedback metrics tested, behind both Net Promoter Score and top-2-box customer satisfaction. CES still has a role, just not as the headline number.
Does Customer Effort Score Predict Customer Retention?
- Weakly, on its own. A 2015 study of 93 firms across 18 industries found CES the worst of five customer feedback metrics at identifying which customers would leave. A 2025 study of online shoppers suggests why: effort reduction improves experience and satisfaction, and those drive retention, rather than effort predicting retention directly.
Should B2B Companies Track Customer Effort Score?
- Track it operationally, at specific points like onboarding or support, not as your governing relationship metric. Feed a low score into root-cause analysis rather than reporting it alongside NPS. For the number that goes to the board, Net Promoter Score, weighted by account value, predicts retention better.